Posts

Global Demographics and Economic Growth

Image
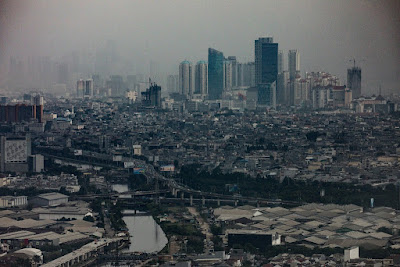
Jakarta - 30 million people and sinking INTRODUCTION Since the beginning of the Agricultural Revolution about 10,000 years ago, demographics meant high birth rates, high infant mortality rates and high death rates. Until the Industrial Revolution, starting in the late 1700s. At first, death rates fell faster than birth rates. Then better public health and health care reduced mortality rates from infection, epidemics and diseases. Then a combination of more effective birth control and social and economic change reduced birth rates.  During these transition periods, average life expectancies increased. After World War II, the global population exploded: 1900 – Appoximately 1.6 billion people 1950 – 2.6 billion 2000 – 6.1 billion 2020 – 7.8 billion The industrialized parts of the world now have low birth rates – mostly below replacement – and low death rates. Birth rates are also falling in much of the rest of the world.  GLOBAL DEMOGRAPHICS

Stock Market Investment Primer

Image
This primer is aimed at the long-term investor. But this does not mean that you should necessarily hold all of the stocks and funds in your portfolio for a long time. WHY STOCK PRICES GO UP The movement of a stock index such as the S&P 500 or an individual stock depends on two things: Earning per share (EPS) and changes in EPS. Stock price/earnings per share ratio (PE ratio) and changes in the PE ratio. If the PE ratio stays the same, an increase in EPS often leads to an increase in the stock price. The same is true of a stock index. Rising EPS combined with a rising PE ratio is often the reason why a stock goes up more than the average stock. Since 2009, the beginning of the stock market recovery from the last recession, most of the increase in stock prices has been due to the increase in earnings per share (EPS). Well, that was easy. Well, not really. The stock market is “forward-looking,” that is, it tries to anticipate change, especially cha